Hi! For some reason we can't display an ad here, probably because of an ad blocker. We have full respect if you want to run an ad blocker, but keeping this website and related softwares free depend on ads. We would appreciate if you add us to your white list or consider donating via Paypal. Thank you!
PerfMonitor 2 (PM2) is a processor performance and monitoring tool. It allows to track up to 4 processor-related events choosen in a model-specific list. It succeeds to PerfMonitor, and in addition to that first version, PM2 includes monitoring data, like temperatures and powers.
MY ACCOUNT
Hi! For some reason we can't display an ad here, probably because of an ad blocker. We have full respect if you want to run an ad blocker, but keeping this website and related softwares free depend on ads. We would appreciate if you add us to your white list or consider donating via Paypal if ads really bother you. Thank you!
Run the setup executable file, and let it guide you for the installation process.
How to use PM2
Using PM2 does not require to be a hardware specialist, on the contrary it was designed to b very easy to use. Nethertheless, some basic processor notions are recommanded to use PM2 at its best.
Terminology
A processor refers to a socket or a package. It includes one or several cores. Each core consists in one or two CPUs (two in the case of the support of Hyper-Threading). A counter represents an event tracked on the processor. Depending on the event, it can be reported at the CPU level (for example CPU usage), the core level (for example core temperature), or at the processor level (for example package power).
Interface
PM2 consists in two views :
The counter selection view includes 4 processor counters and allows to choose the counters to track. When possible, the data reported on these counters are at the processor level.
The CPU counter view shows the counter value at the processor, core or CPU level. It does also include basic information on the processor.
Processors, counters configurations and counters selection
Select a processor
If your system includes more than one processor, you can select the processor to monitor by selecting it in the menu Selection → Processor. You can then view the list of available counters in the menu Selection → Counters.
Select a counter
In the counter selection view, left click on a graph to select it. You can change the counter either by right clicking on the selected graph, and choose the counter in the menu, either by selecting it in the menu Selection → Counters. A check will indicate the current counter selection.
Counters Configurations
The nature and the number of counters depends on the processor model and family. Some counters are using the processor 's performance monitoring features, and because performance monitoring does only allow a few number of events to be monitored in the same time, PM2 allows to switch between several counters configurations. Some counters are present in all configurations, and some others are only available with a specific configuration. The table below shows all the counters available on the supported processors. You can select the counters configuration in menu Selection → Counters Configurations. The Selection → Counters menu is dynamically updated to include the counters that are available in the current configuration.
Remove PM2 (setup version)
Windows XP/2000/Vista/7
You can remove the program either from the Add or Remove Programs window (from Settings, Control Panel), or choose Uninstall PerfMonitor2 from Start menu, Programs, CPUID, Perfmonitor2.
Windows 8
Open the Control Panel (for example from the menu Windows + X), then choose Programs, and Remove Programs.
Counters definition
Caches request rate and hit ratio
The cache requests rate is the ratio between the number of requests to that cache and the total number of instructions. The cache hit ratio is the ratio between the number of requests to the cache that resulted in a success (the required data was found in the cache) and the total number of requests to the cache.
Branch Instructions rate and branch hit ratio
Branch instructions rate is the ratio between the number of branch instructions (x86 jz/jnz/jg …) and the total number of instructions. The hit ratio reflects the performance of the branch prediction mechanism.
IPC/CPI
IPC stands for Instructions per clock, and refers to the ratio between the number of instructions retired and the total number of cycles, in other words the average number of instructions retired at every clock cycle. CPI, or Cycles per Instruction, is the invert of IPC.
MIPS/GIPS
Million instructions Per Second (MIPS) and Giga (billion) Instructions Per Second (GIPS) reflect the rate at which a CPU executes instructions.
Stalled cycles ratio
The stalled cycles refer to the clock cycles where no instruction was retired from the CPU pipeline. The ratio between the stalled cycles and the total cycles provides the stalled cycles ratio.
Unhalted clock cycles
The unhalted clock cycles count the cycles when the CPU is not in the halted state. When the processor is not in activity, it spends a lot of time in HLT state, and the unhalted clock cycles are very low. When the processor is at 100% load, the unhalted clock cycles show the current frequency, unless
the CPU is throttling.
Usage
CPU usage reflects the CPU activity, as reported by Windows task manager. It can be assimilated to the ratio between unhalted clock cycles and the maximum processor frequency.
Instructions per Watt (IPW)
IPW is the ratio between the total number of instructions retired and the power disspation of the processor (package power). It is computed at the processor level because so is the power. PM2 does report that value as million instructions retired per Joule consumed (whereas watts are Joules per second).
Powers
The package power, in watts, reflects the processor power dissipation. If the processor is not overclocked or over-volted, that value must always be below the TDP value (Thermal Design Power) reported in the processor information.
Depending on the processor, other powers may be available : IA cores (the core units), GT (IGP), uncore (IMC, L3).
Temperatures
The processor may report different temperatures : one temperature for the complete package, and/or one temperature per core.
Supported Hardware & OSes
Processors
The table below shows the counters available on the different processors supported by PM2. CC0, CC1 and CC2 refer to the counters configurations.
- Usage - Core Temperature - Package Temperature - Package Power - IA Cores Power - GT Power - Uncore Power - Package Temperature - MIPS/GIPS - Unhalted clocks - IPC/CPI - Instructions per Watt
- L2 Requests Rate - L2 Hit Ratio - L3 Request Rate - L3 Hit Ratio
- Branch Instructions Rate - Branch Hit Ratio - Stalled Cycles Ratio
- Usage - Package Temperature - Package Power - Core Temperature - MIPS/GIPS - Branch Instructions Rate - Branch Hit Ratio - L3 Requests Rate - L3 Hit Ratio
- L2 Requests Rate - L2 Hit Ratio
- Unhalted clocks - Stalled Cycles Ratio - IPC/CPI - Instructions per Watt
- AMD Trinity - AMD Richland - AMD Kabini
- Usage - Package Temperature - Package Power - Core Power - Uncore Power - MIPS/GIPS - Branch Instructions Rate
- L2 Requests Rate - L2 Hit Ratio
- Unhalted clocks - Stalled Cycles Ratio - IPC/CPI - Instructions per Watt
Operating Systems
PM2 runs on Windows XP, 2000, Vista, 7 and 8.
Profiles
When you have chosen a set of counters, they are automatically saved in a profile, and restored at the next run of PM2. You can also manually save a set of counters in a separate profile file, and load it afterwhile. You can then make your own predefined profiles, to focus on specific data types, like powers, caches, branches … Please note that a profile does also save the counters configurations, so you won't need to set it manually before you load a profile.
Use Menu File → Save Current Profile allows to save the counters set in a ,pm2 file., and use menu File → Load Saved Profile to restore a saved profile.
PM2 relies on performance monitoring and on hardware monitoring, and those are sepecific to a processor model. The huge number of processor references does not allow PM2 to support all processors, unfortunately, and our priority is to support the latest generations of processors. Nethertheless, we plan to add older references if the number of requests is high enough. Please note that if your processor is not supported, PM2 will only propose the processor usage counter.
2.
My processor is supported, but PM2 does not display all expected counters.
Please save a DEBUG report (menu File → Save DBG report) and send us the generated file via the bug report form.
3.
Why does the CPU counter view show a variable number of graphs ?
That is related to the level of the information read by PM2. In order to illustrate that, let's consider the temperature counter. AMD processors do only return one package level temperature, that results in one unique graph in the counter view. Consequently, that graph is a clone of the one in the counter selection view. On Intel Nehalem processors, each core returns its own temperature, that causes it to display one graph per core. Since no average can be made on temperatures, the counter selection view does report the temperature of the 1st core. The Intel Sandy Bridge processor returns one temperature per core, plus one package temperature. That package level information is used in the counter selection view, whereas the CPU view shows as many graphs as there are cores on the processor.
4.
My processor has a Turbo capability, how can I see it in action ?
Turbo can be seen through the counter Unhalted Clock Cycles.
5.
Is PM2 able to show throttling ?
Power and thermal throttling results in a decrease of the clock speed when the processor is at 100% load. That phenomenom can be seen through the Unhalted Clock Cycles counter, but only when the processor is at 100% load. At 100% load, the unhalted clock cycles should show a frequency equal or greater than the Max Clock Speed shown in the information panel (possibly greater if the processor supports Turbo). If it is below that value, then the processor is throttling.
6.
How do I reset PM2 settings ?
Locate the file « PerfMonitor2.ini » in the installation folder, and delete it.`
7.
Why can't I run two instances of PM2 ?
PM2 does (re)configure specific registers, and therefore two instances of PM2 would collide.
8.
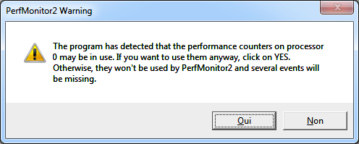
When I open PM2, I get the following message :
A8- PM2 uses the performance counters that are a shareable ressource of a processor. PM2 is compliant with the performance counters utilization guide that requires to check the counters state before using them, that could be the case if another program that uses the performance counters is already running (PerfMonitor 1 for example). Otherwise, that situation can occur if the previous instance of PM2 was not correctly closed (from the task manager, or if the system crashed, or if PM2 ended with a GPF – general protection fault).
If you choose « Yes », PM2 will reprogram the performance counters and use them. If you choose no, only counters that are not using the performance counters will be used.